The project
A digital twin is a model that runs alongside a real machine and is kept in step with it, so that the difference between the two says something about the machine. This project is a small working version on an Arduino Uno, deployed from Simulink in Monitor & Tune mode. A thermistor stands in for a temperature sensor bolted to a machine, such as a bearing housing or a gearbox.
A physics model of that machine runs next to the sensor in real time and keeps itself calibrated with recursive least squares. It raises two different alerts, an immediate anomaly and a slow-building maintenance warning, because those two faults mean different things and happen on different timescales.
The key design idea is that the twin is not a mirror of the sensor. It integrates its own physics and is only gently corrected by the measurement. If it simply copied the sensor, the two could never disagree and there would be nothing to detect.
What it does
- A model that runs independently of the sensor. The disagreement between the two can be measured.
- A Luenberger observer correction. It keeps the model aligned with reality without turning it into a copy of the sensor.
- Online parameter estimation. The model learns how fast the machine cools instead of relying on a fixed guess.
- Two-tier condition monitoring. A red LED for a short-term anomaly and a blue LED for sustained elevated running, with a 16x2 LCD showing the temperature and status.
| Alert | What it means | Trigger | Indicator |
|---|---|---|---|
| Anomaly | Something unexpected is happening now, such as a sudden load or a friction event | Model and sensor disagree by more than 2 °C on two samples in a row | Red LED, and the LCD shows ANOMALY |
| Maintenance | The machine is running hotter than its normal baseline for a sustained period, which suggests worn parts or lost lubrication | Sensor above 28 °C continuously for 20 s | Blue LED, and the LCD shows MAINTENANCE |
On the bench, touching the thermistor simulates an anomaly, and holding it warm for a sustained period simulates degradation. A DC fan switches on above 29 °C. It acts as a cooling action and also as an extra disturbance the model does not know about.
Hardware
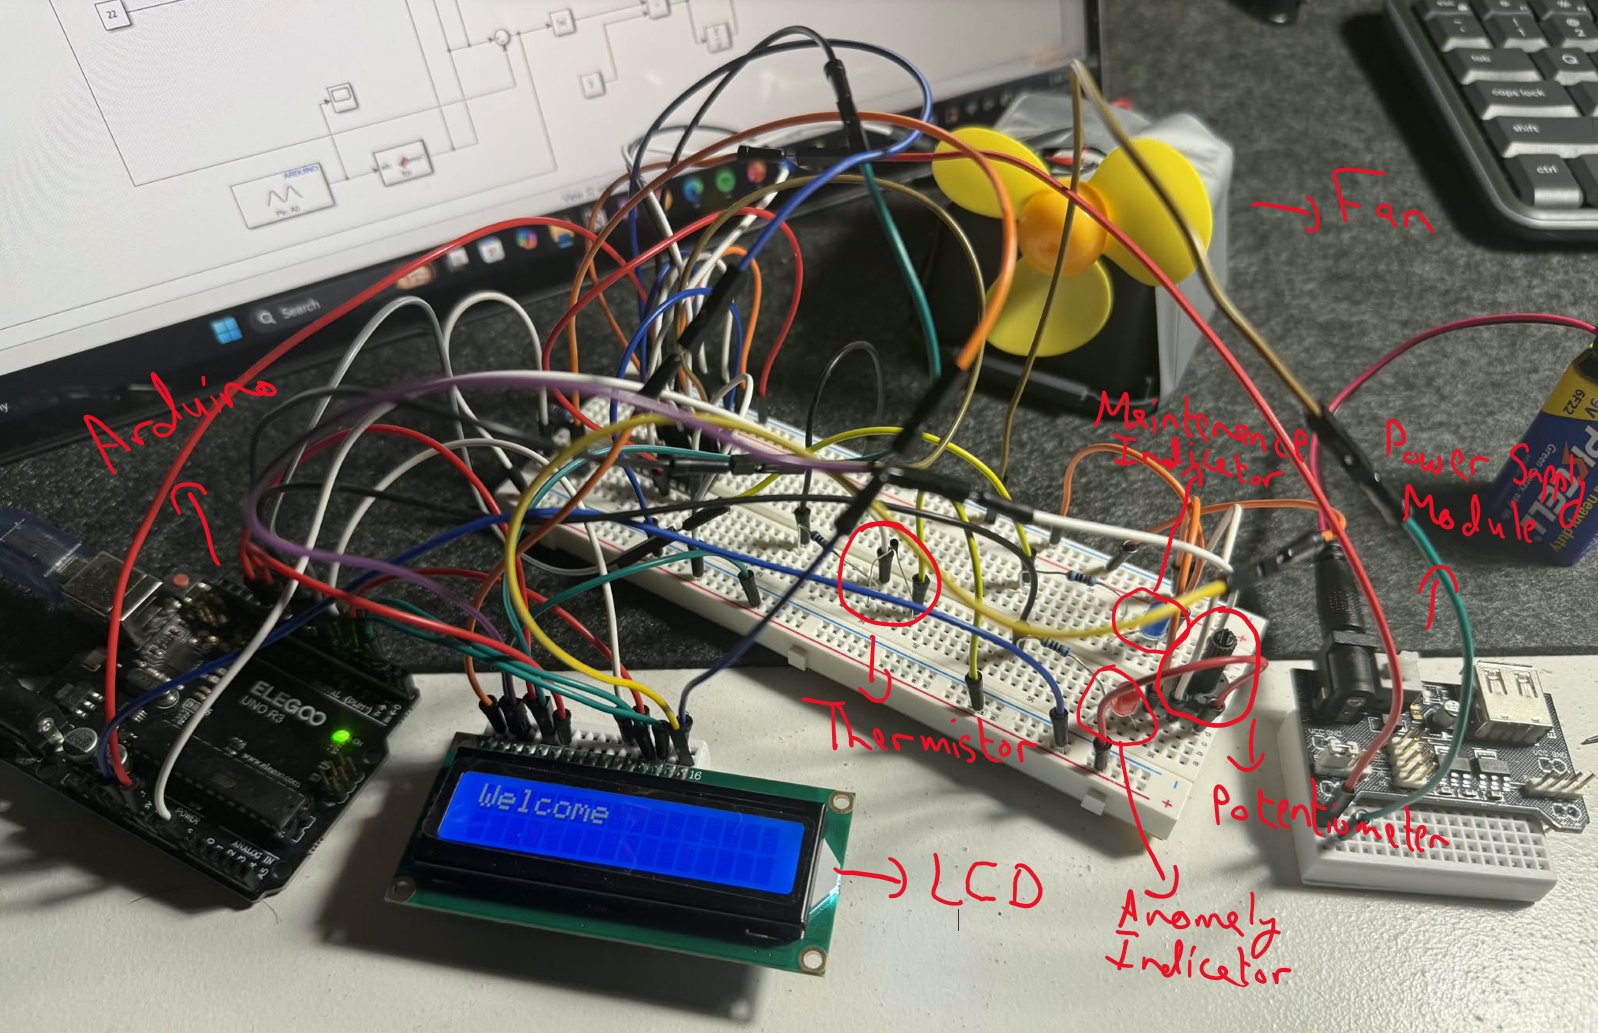
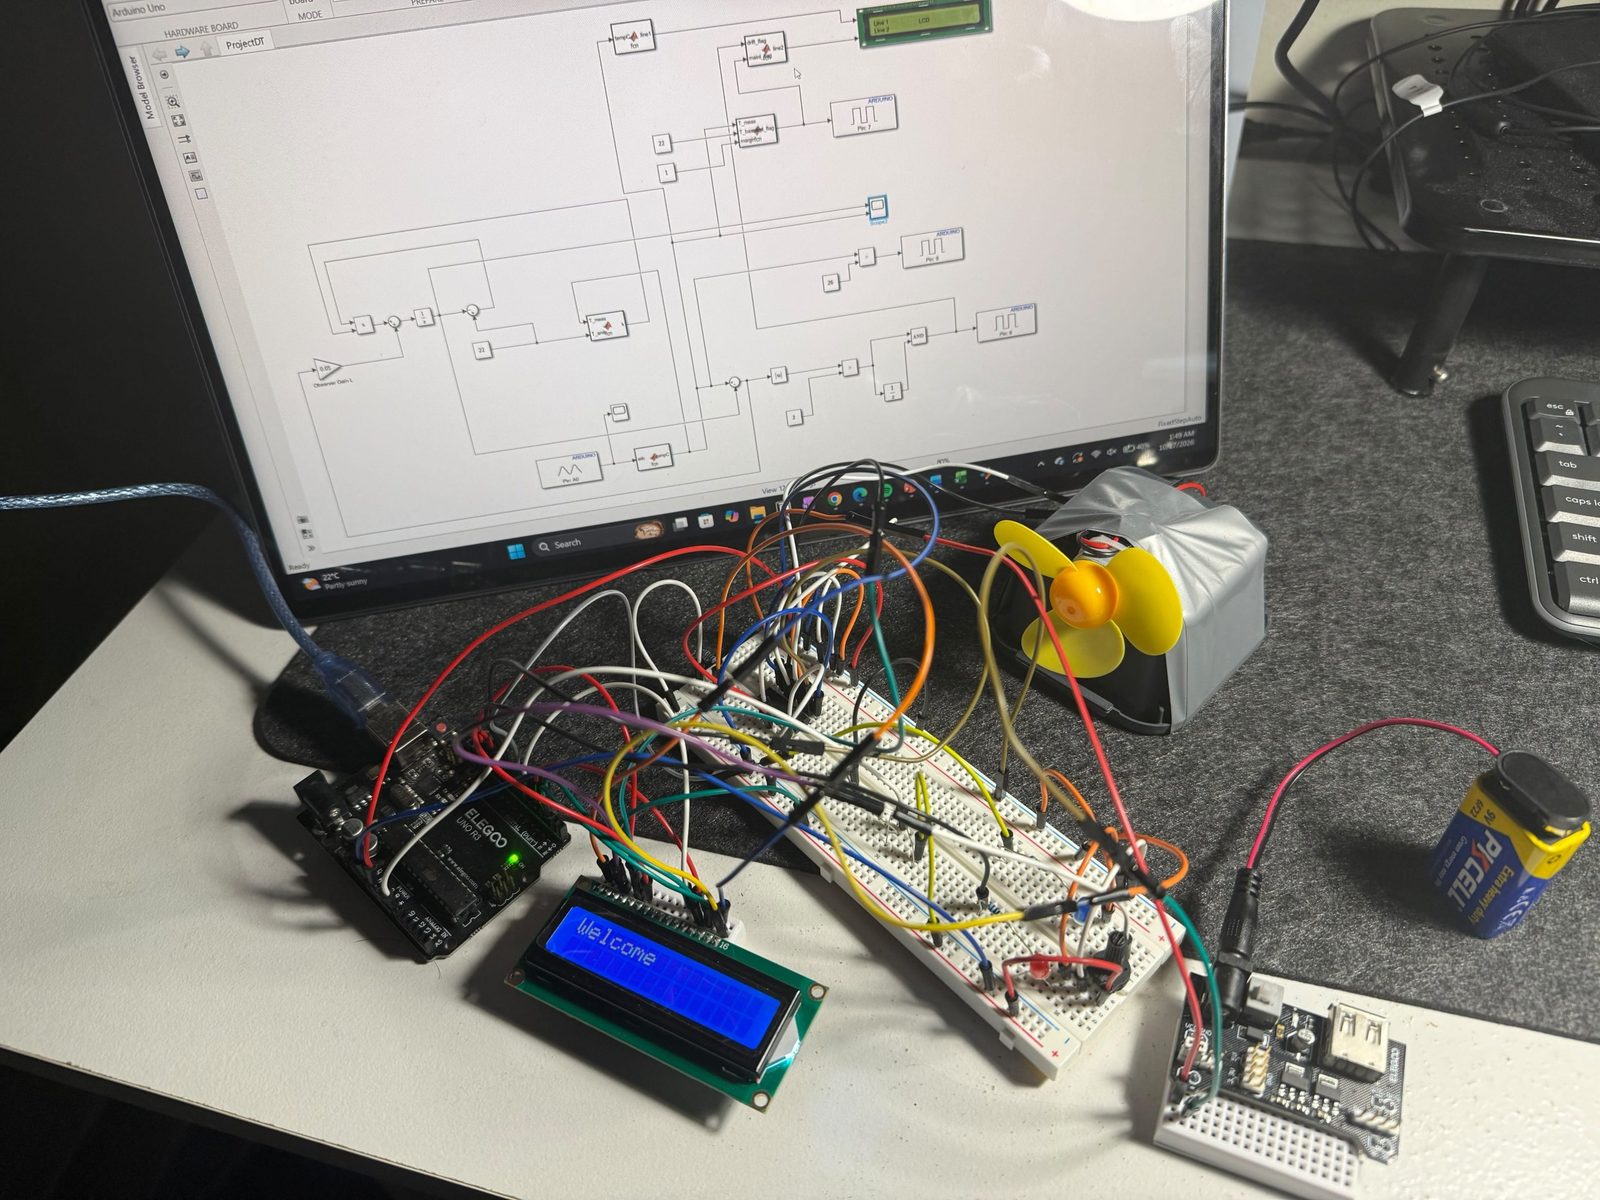
Everything runs on an Elegoo Uno R3 from a standard starter kit, tethered to a laptop over USB. A 10 kΩ NTC thermistor and a 10 kΩ resistor form a voltage divider into analog pin A0. A red LED on D8 shows an anomaly and a blue LED on D7 shows maintenance. A 1602 LCD in 4-bit mode shows the temperature and status, with a potentiometer for contrast.
The fan is a bare DC motor, so it cannot be driven from a digital pin directly. It runs through one channel of an L293D H-bridge, with input 1 from D9. Pins D0 and D1 are left free because they carry the serial link that Simulink uses in external mode.
The model
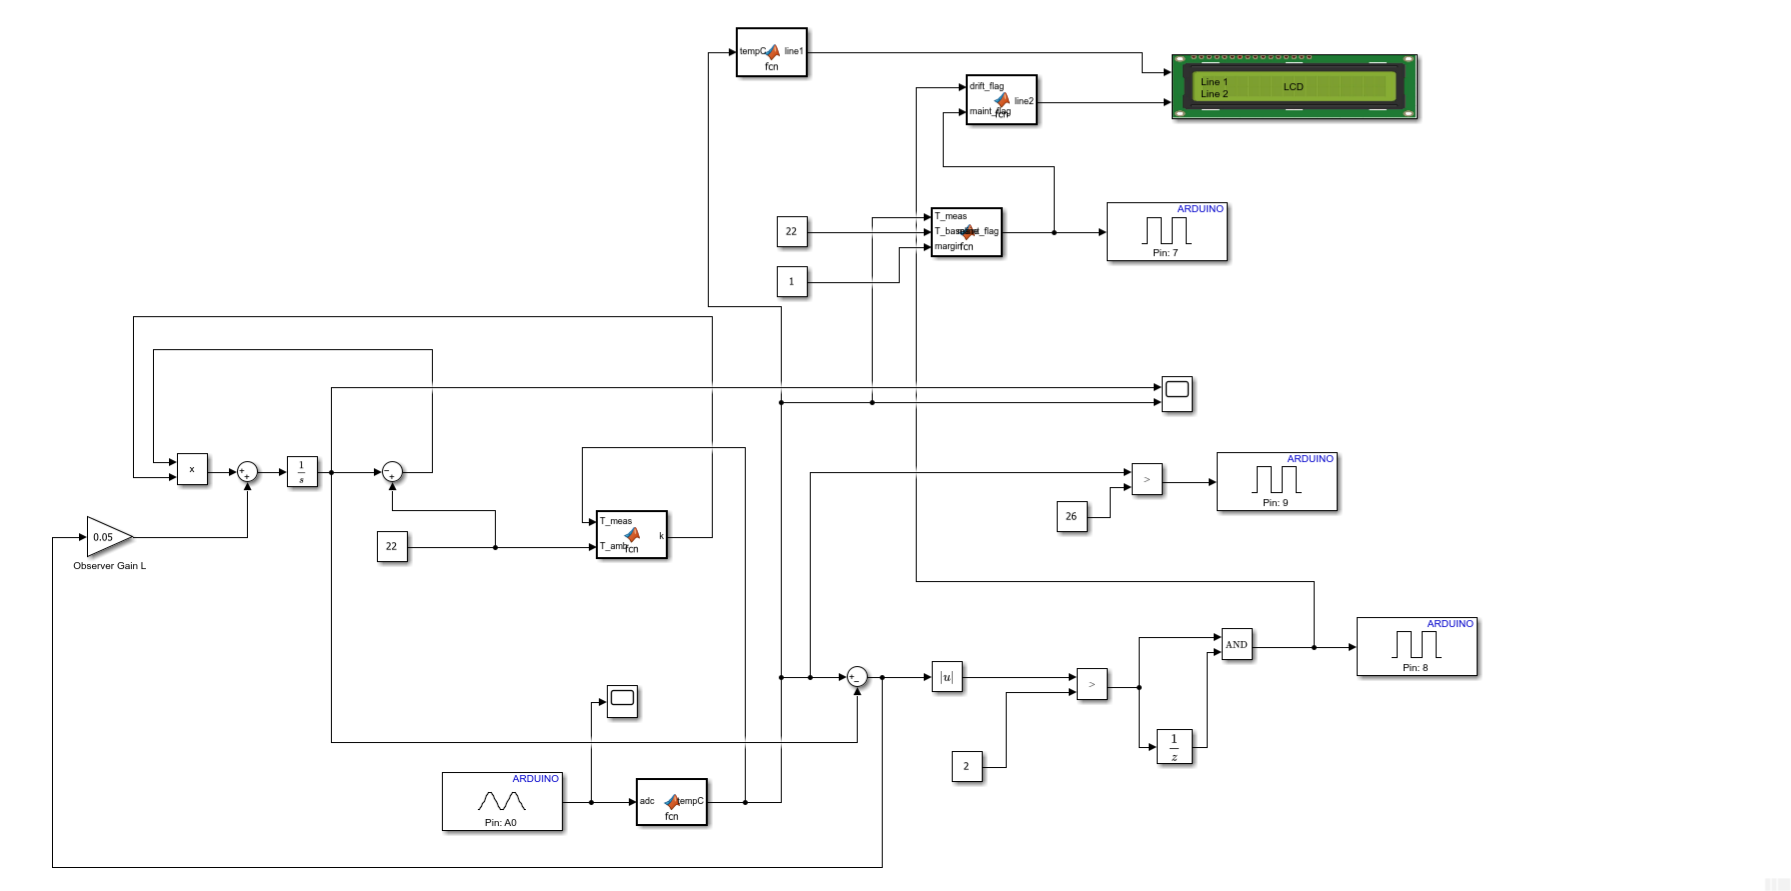
The 10-bit ADC count is converted to a voltage, then to the thermistor’s resistance from the divider, then to a temperature with the beta equation (β = 3950, R0 = 10 kΩ at 25 °C). The twin is a first-order thermal model, Newton’s law of cooling, with an observer correction:
dT_twin/dt = k(T_amb - T_twin) + L(T_meas - T_twin)
The first term is what the model believes the physics should do, which is to relax toward ambient at a rate set by k. The second term is reality pulling on the model, in proportion to how wrong it currently is. With L = 0.05 the twin moves 5% of the way toward the measurement each second, so it follows a disturbance with a visible lag.
Learning the cooling rate
The cooling coefficient k is not known in advance, so it is estimated live by scalar recursive least squares with a forgetting factor of 0.99. The regression is set up so that the unknown appears as a single parameter, θ = −k. The measurement is low-pass filtered first, because one ADC count is about 0.09 °C, and differentiating raw counts gives a noise signal about as large as the real cooling rate.
The estimator only adapts during genuine free cooling, and θ is clamped to a physically valid range. The toolbox version of the estimator would not fit on the Uno, so I wrote the scalar RLS function by hand. The whole Simulink model is 27 blocks in one layer, running at a 1 s sample time.
How the alerts work
Anomaly. The residual, measured minus predicted, is compared against 2 °C. A unit delay and an AND block require the condition on two consecutive samples, so a single noisy reading cannot trip the alarm. The 2 °C threshold was chosen against the sensor’s observed noise floor. At 1 °C the LED stayed on continuously at rest, because the twin and sensor naturally sit about a degree apart from ADC quantisation, estimator adjustment and room air movement.
Maintenance. A timer adds one second each time the sensor reads above the baseline plus margin (26 + 2 = 28 °C), and any single reading below the limit resets it to zero. At 20 s of unbroken elevation the flag goes true. That reset-on-dip rule is what separates a sustained trend from a passing spike. The red LED asks whether the model is wrong right now, and the blue LED asks whether the machine has been running hot for a meaningful period.
Display. Row 1 of the LCD shows the measured temperature to one decimal place, and row 2 shows OK, ANOMALY or MAINTENANCE, with maintenance taking priority because a machine that has run hot for 20 s is the more serious condition. Simulink code generation needs every array size fixed at compile time, so the temperature is not formatted as a string. It is multiplied by 10, rounded, split into digits with integer division, and each digit is written as an ASCII code into a fixed 16-byte buffer.
What went wrong
Most of the engineering in this project was in diagnosing failures. The four model bugs were the most instructive, because each produced plausible-looking behaviour on the scope that traced back to a single sign, value or gate. These are the main ones, in the order they happened:
| Symptom | Root cause | Fix |
|---|---|---|
| The twin never moved | The integrator started at the same value as ambient, so the rate was permanently zero | Initial condition set to 26 °C and ambient to 25 °C |
| The twin diverged to about −2×10⁵ | The sign order on the sum block made the loop positive feedback | Sum set to ambient minus model |
| The twin ran the wrong way during heating | The estimator treated heating data as self-heating, which flipped the cooling coefficient positive | Adapt only when the signs say the system is cooling, and clamp the coefficient |
| The cooling estimate collapsed to zero | The typed ambient did not match the sensor’s true resting value, which biased the regression | Ambient matched to the resting reading, and an excitation gate added |
| The toolbox estimator overflowed the Uno’s memory (106.7% of program space) | The System Identification block generates far more code than 32 KB of flash allows | Replaced with a hand-written scalar RLS function |
What I found
Tracking and detectability pull against each other. The observer gain L sets how much the twin trusts the sensor. In a reconstruction of the system with a heating disturbance, the peak residual fell as L went up, and at L = 0.2 the anomaly alarm stopped firing altogether. The final design uses L = 0.05, which keeps a disturbance residual of about 2.6 °C against the 2 °C threshold.
| Observer gain L | Peak residual during a disturbance | Anomaly alarm at 2 °C |
|---|---|---|
| 0 (open loop) | 9.1 °C | Fires, but the twin never recovers |
| 0.05 | 2.6 °C | Fires and clears |
| 0.1 | 1.6 °C | Does not fire |
| 0.2 | 0.94 °C | Does not fire |
These figures come from a simulated reconstruction, not logged hardware data. The shape of the result is what matters: a well-tuned correction term hides the very drift you want to detect. A mature system should therefore monitor how hard the correction is working, and not only the size of the residual.
- An estimator must refuse to learn from the wrong data. Without the sign gate, the cooling coefficient flipped positive during heating and inverted the twin’s dynamics.
- Small offsets matter more than expected. A typed ambient value a degree or two from the sensor’s true resting reading was enough to drive the cooling estimate to zero and freeze the twin.
- Thresholds should reflect the measured noise floor. A tolerance tighter than the sensor’s natural fluctuation gives a permanent alarm, which is as useless as no alarm.